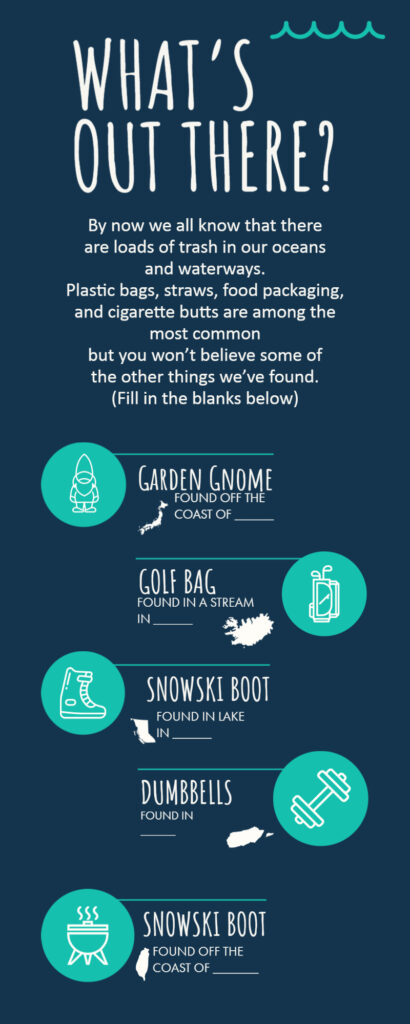
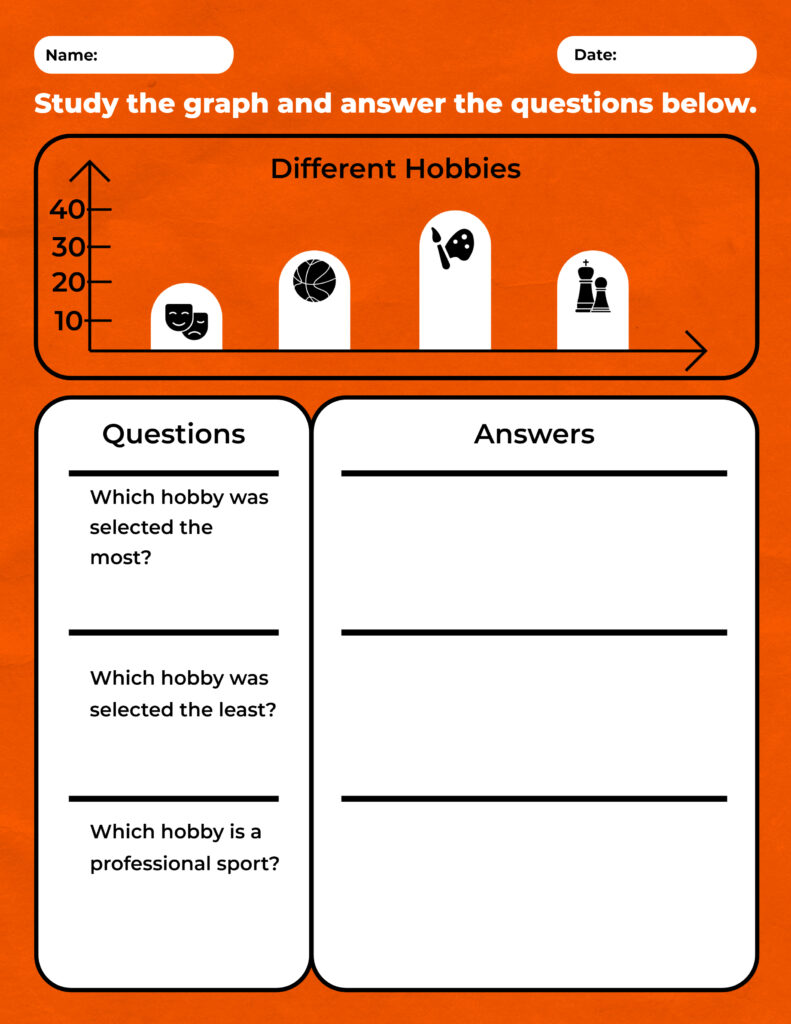
Take a look at the following examples. If you would like to learn more about creating infographics in Adobe Express for your D2L course, contact Dr. Teresa Bussell in the Office of Academic Technology, Teresa.Bussell@tamuc.edu


Feb 10
Take a look at the following examples. If you would like to learn more about creating infographics in Adobe Express for your D2L course, contact Dr. Teresa Bussell in the Office of Academic Technology, Teresa.Bussell@tamuc.edu


Permanent link to this article: http://sites.tamuc.edu/innovations/did-you-know-you-can-use-adobe-express-to-create-infographics-for-data-analysis/
Recent Comments